 | "A microscopist thinks with the eyes and sees with the brain."
(Prof. Daniel Mazia, 1996) |
A broad variety of techniques available at various
facilities in the Faculty of Sciences have been enfolded during the preparation of the Virtual Classroom Biology: imaging techniques involving microscopy, (digital) photography and graphical design, as well as informatics techniques (lama and java scripts).
Concerning microscopy, a number of specialized techniques have been applied for this didactical purpose:
light microscopy, among which conventional transmission,
video microscopy, fluorescence [ratio]-imaging (1 and 3) and
confocal laser scanning microscopy (CLSM; 2), as well as
electron microscopy in both transmission (TEM; 4) and scanning modus (SEM; 5).
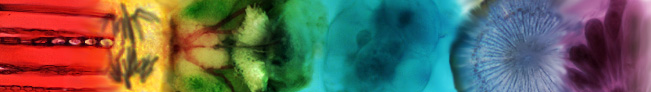
In scientific research and medical diagnosis, by contrast to didactical imaging, the emphasis is put on specific measurements and the recognition of patterns typical for certain diseases. The montage left shows a number of set-ups where students, university teachers and researchers work each day. Extensive explanations on technical aspects of microscopy can be found elsewhere (see under
links).
Tip: visit the fesem simulator and the laser3d confocal microscopy page.
Light microscopy is applied to study objects in the order of magnitude of 1 µm (one thousand of a millimetre) to 5 mm. Bright field images are the most common type of images that can be made with a conventional light microscope (
1A). Specific
stains (e.g. Alcian blue, hematoxiline, toluidin blue and eosin) are often used to selectively emphasize structures in biological samples. Other techniques to highlight certain structures are phase contrast (
1B), dark field (
1C), differential interference contrast (=DIC,
1D), conventional fluorescence microscopy (
1E,
1F,
1G) and confocal laser scanning microscopy (
1H and
1I).
| Various light microscopical techniques |
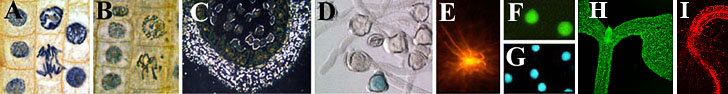 |
A-D transmission and E-G fluorescence microscopy.
Contributions: J.W.M. Derksen, B. Kramer, M.C. Nardi, E.S. Pierson, H.P. Xu and G. Bögemann |
1A. Bright field view of dividing cells in the tip of an onion root stained with hematoxyline.
1B. Phase contrast view of dividing cells in the tip of an onion
root stained with hematoxyline.
1C. Dark field image of pollen mother cells of Lilium candidum. Cell walls appear bright due to light breaking.
1D. Differential interference contrast view of germinated pollen of tobacco (Nicotiana tabacum). The blue color is the result of a so-called GUS reaction that indicates that a particular gene is active in this cell.
1E. Fluorescence view of brain cells of a South-African frog (Xenopus laevis). The cells are stained with DiI, a substance that binds to fatty compounds.
1F. Fluorescence view of isolated sperm cells of a tobacco plant
(Nicotiana tabacum) treated with fluoresceine diacetate; the green color indicates that these cells are living.
1G. Fluorescence view of isolated sperm cells of tobacco (Nicotiana tabacum).
1G. Fluorescence microscopy of the same object as in F, but here the blue fluorescing probe, DAPI, specifically stains DNA in the cell nucleus.
1H and I. Confocal laser scanning microscopy (projection) showing GFP pattern and autofluorescence in a genetically modified seedling (plumula and rootlet).
|
In modern research it is common to employ more specific (i.e. fluorescing) markers, like labelings with antibodies, enzymatic reactions, Green Fluorescent Proteins, organelle-specific dyes and ion indicators, and often combinations of different markers (e.g. a fluorochrome with green emission light for mitochondria and another with blue emission for DNA). It has alsobecome possible to quantitatively determine how intens the fluorescence signal is as a measure for the presence of a certain element or substance in cells or other objects. There also exist so-called ratio imaging fluorescence probes with which the concentration of the labeled (bound) target can be analyzed by comparison of the intensity of the signal using two (excitation or emission) colors (wavelength of light).


